Digital Forensics and Incident Response (DFIR) is a specialized field of cybersecurity, comprising two different areas. Forensics is the part of the investigation done after an incident has occurred. It involves the collection, preservation, and analysis of digital artifacts. This is done using advanced tools, which we shall discuss in the sections below. Forensics can be mainly classified into disk & memory.
Incident response is the process of detecting, containing, and normalizing threats as they occur. This also involves live monitoring of systems using tools like EDRs, etc.

Digital Forensics
Since this field involves collection and analysis of artifacts and evidence, depending on where we collect them from, it is mainly of two types:
Memory Forensics
These are found in the system’s volatile memory (RAM), and unlike disk artifacts, they disappear when the system powers down. This makes memory forensics time-sensitive but also incredibly valuable, since it captures the live state of a system, i.e things a disk image alone can’t show.
Key sources include: Running processes and their metadata – process trees, command-line arguments, parent-child relationships (useful for spotting process injection or masquerading). For this, use System Informer.
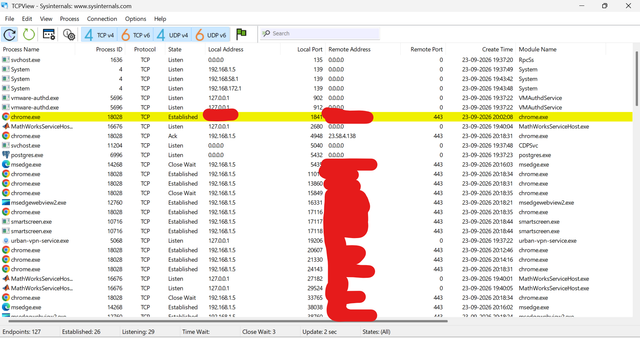
Network connections – active sockets, listening ports, and associated processes at the time of capture. https://download.sysinternals.com/files/TCPView.zip
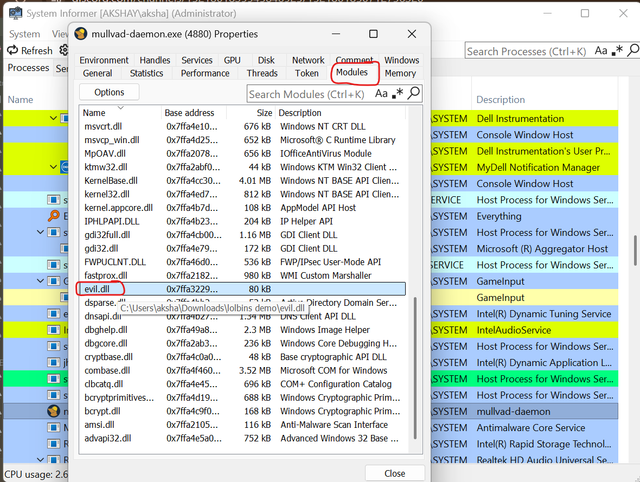
Loaded DLLs and modules – can reveal injected or unbacked code segments. Access this by double-clicking a process in system informer and clicking on the “Modules” tab.
Encryption keys and credentials – often recoverable in plaintext from memory even when they’re encrypted at rest.
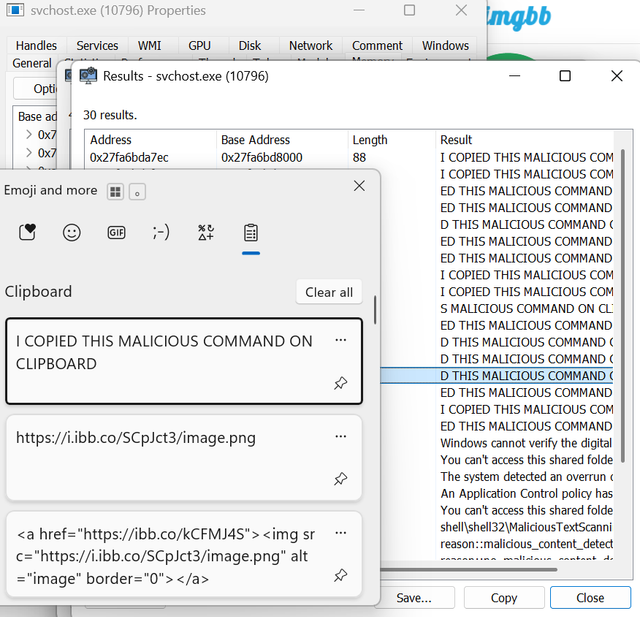
Malware artifacts – fileless malware, in-memory payloads, and reflective DLL injection leave no trace on disk but persist in RAM, Clipboard contents (clipboardsvc), open handles, and registry hives loaded in memory
Common tools for memory analysis include Volatility (and Volatility 3), Rekall, and WinDbg for deeper kernel-level analysis. Memory acquisition itself is typically done with tools like FTK Imager, DumpIt, Magnet RAM Capture, or WinPmem, which create a raw memory dump for offline analysis.
Volatility Basics
Once you have a raw memory dump, Volatility 3 is the most famous tool to analyze it. Every command follows the same pattern: python3 vol.py -f <dump> <plugin>(python3 -> `python` on Windows). Plugins are namespaced by OS, so Windows plugins start with windows., Linux with linux. and so on.
| Plugin | What it shows | Why you’d use it |
|---|---|---|
windows.info | OS version, build, architecture, kernel base | Confirms the image is valid and symbols resolve before you do anything else |
windows.pslist | Processes from the active process list, with PID, PPID and start time | First look at what was running |
windows.psscan | Processes found by scanning memory pool tags | Finds hidden or terminated processes that pslist misses. Compare the two outputs |
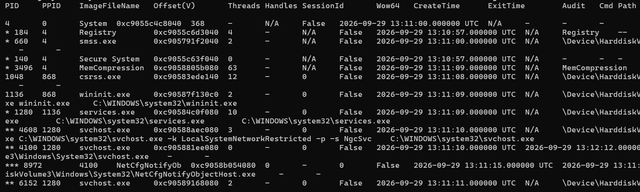
windows.pstree | Parent-child process hierarchy | Spotting odd lineage such as winword.exe spawning powershell.exe, or a fake svchost.exe with the wrong parent |
windows.cmdline | Full command-line arguments per process | Reveals encoded PowerShell, LOLBin abuse and suspicious paths |
windows.netscan | Network connections and listening sockets with owning PID | Finds C2 connections and unexpected listeners |
windows.malfind | Memory regions that are executable and not backed by a file on disk | Primary plugin for injected code and in-memory payloads |
windows.dlllist | DLLs loaded by each process | Spotting unusual or side-loaded modules. Use --pid to focus on one process |
windows.handles | Open handles (files, registry keys, mutexes) | Malware often creates recognizable mutexes |
windows.svcscan | Windows services and their binary paths | Checking service-based persistence |
windows.filescan | File objects cached in memory | Finding files that existed in memory even if deleted from disk |
windows.registry.hivelist | Registry hives loaded in memory | Starting point for windows.registry.printkey, for example to inspect Run keys |
windows.hashdump | Local account NTLM hashes | Assessing credential exposure |
Example: vol.exe -f dump.raw windows.pstree gives this output:
Disk Forensics
Disk forensics covers evidence pulled from secondary storage, i.e HDDs, SSDs, USBs, or disk images. Since almost everything eventually touches disk, it’s usually the richest evidence source.
File system artifacts. $MFT is NTFS’s master catalog of every file and folder, with MACB timestamps; deleted files often leave residual entries. $UsnJrnl and $LogFile track file changes and recent file system operations over time. Volume Shadow Copies are Windows snapshots that can preserve older file versions, sometimes surviving deletion or ransomware.
Proof of execution. Prefetch shows what ran, how often, and when. Amcache and Shimcache record metadata on executed or present binaries — paths, SHA1 hashes. BAM/DAM, Jump Lists, and LNK files add more execution and recent-access traces, even after the original file is gone.
Registry artifacts. Hives like SYSTEM, SOFTWARE, SAM, and NTUSER.DAT hold installed software, USB history, Run keys (a common persistence spot), and recently opened files. ShellBags track folder access, even for folders that no longer exist.
Logs. Windows Event Logs found in Security, System, PowerShell, and Sysmon together capture logons, process creation, and service or task installs. Scheduled tasks and services are another common persistence spot, logged in both the registry and event logs.
File content. File carving rebuilds deleted files from unallocated space. Slack space holds leftover data in the unused part of a disk cluster. Alternate Data Streams can hide data; the ZoneIdentifier stream, for example, flags files downloaded from the internet.
Common tools include Autopsy/Sleuth Kit, FTK Imager, EnCase, KAPE, and Eric Zimmerman’s tools like Registry Explorer.
Disk artifacts stick around, surviving reboots and even some cleanup attempts. That is why they’re the backbone of most investigations.
| Artifact | Location | Tool |
|---|---|---|
| Prefetch | C:\Windows\Prefetch | WinPrefetchView |
| $MFT | C:\$MFT | MFTECmd |
| $UsnJrnl | C:\$Extend\$UsnJrnl:$J | MFTECmd |
| $LogFile | C:\$LogFile | MFTECmd |
| Amcache | C:\Windows\AppCompat\Programs\Amcache.hve | AmcacheParser |
| Shimcache | HKLM\SYSTEM\CurrentControlSet\Control\Session Manager\AppCompatCache | Registry Explorer |
| BAM/DAM | HKLM\SYSTEM\CurrentControlSet\Services\bam\State\UserSettings | Registry Explorer |
| Jump Lists | %APPDATA%\Microsoft\Windows\Recent\AutomaticDestinations | JLECmd |
| LNK Files | %APPDATA%\Microsoft\Windows\Recent | LECmd |
| NTUSER.DAT | C:\Users\<username>\NTUSER.DAT | Registry Explorer |
| Windows Event Logs | C:\Windows\System32\winevt\Logs | Event Log Explorer |
| PowerShell Logs | C:\Windows\System32\winevt\Logs | Event Log Explorer |
| Sysmon Logs | C:\Windows\System32\winevt\Logs | Event Log Explorer |
| Scheduled Tasks | C:\Windows\System32\Tasks | Registry Explorer |
| ShellBags | NTUSER.DAT / UsrClass.dat | ShellBags Explorer |
| Zone.Identifier / ADS | NTFS Alternate Data Stream | AlternateStreamView |
| Disk Image / File System | Disk image / mounted evidence | Autopsy |
Network Forensics
Network forensics involves the examination of traffic that travels across a network. While memory and disk drives reveal what took place on a single machine, the network shows how the various hosts communicated with one another and with the outside world—namely, where the attacker originated from, what they accessed, and what left the environment. It is also the most difficult type of evidence for an attacker to alter, since the packets have already left the machine by the time they attempt to cover their tracks.
What constitutes a PCAP?
A PCAP (packet capture) file consists of a record of network traffic. Each packet observed on an interface is stored together with a timestamp and its headers (including Ethernet, IP, and TCP/UDP), and unless the packet has been truncated, also includes its payload. Such captures are generally available in two formats: the traditional .pcap format and the more recent .pcapng format, the latter of which allows for additional metadata such as information on multiple interfaces and comments. Wireshark is able to open both formats.
The use of tools such as tcpdump, dumpcap, tshark, or Wireshark itself allows captures to be made either on a host or on a network tap or SPAN port. Similar to the case with memory, a capture will only include the data that passed over the wire while the capture was running, so it has to be started at an early stage. Moreover, it should be remembered that encrypted traffic (such as HTTPS, SSH, and VPNs) does reveal metadata including IPs, ports, timing,g and volume, but not the actual content.
The usual tools used for analysis are Wireshark and tshark when working at the packet level, Zeek for converting traffic into structured logs, Suricata for signature-based detection, and NetworkMiner for extracting files and credentials from a capture.
Wireshark Basics: Spotting a Brute Force Attack
Here is a quick workflow for finding a suspicious host in a PCAP:
- Load the capture. Just drag the
.pcapfile and drop it into Wireshark. - Identify the noisy hosts. Navigate to
Statistics → Endpoints, then open the IPv4 tab and sort according to Packets. The hosts at the top are the ones carrying out the most communication. In this case,194.61.24.102is particularly noticeable. - Filter on that host. Apply the display filter
ip.addr == 194.61.24.102so that you can see only the traffic going to and from that host. - Look at the timing. Count the number of packets that this IP address sent and determine the time period involved. Sending a large number of packets over a short period of time, mainly to one destination and port, is characteristic of automated guessing rather than of human activity.
The fact that so many packets are sent in a short time suggests that it is a brute force attack, i.e a tool which tries various username and password combinations against a login service such as SSH, RDP, or a web login. Genuine users never open hundreds of connections in a matter of seconds.
When you have a suspect, you can verify this by looking at a few more views: the Statistics → Conversations option tells you which destination ports the IP address contacted, and the Statistics → I/O Graph shows the traffic spike over time. These kinds of findings are then directly used in the incident response process, which involves blocking the IP address, checking the authentication logs for a successful login from it, and looking for any sign that the attacker eventually gained access.
| Wireshark feature | Where | Why you’d use it |
|---|---|---|
| Endpoints | Statistics → Endpoints | To identify the hosts that are sending or receiving the highest number of packets |
| Conversations | Statistics → Conversations | To see which hosts have communicated with each other and on which ports |
| I/O Graph | Statistics → I/O Graphs | To detect traffic spikes over time |
| IP filter | ip.addr == x.x.x.x | To isolate all the traffic for one host |
| Follow Stream | Right-click a packet → Follow → TCP Stream | To reconstruct a complete conversation |
| Export Objects | File → Export Objects → HTTP | To recover the files that were transferred over HTTP |
Incident Response
Incident response is the operational half of DFIR. Where forensics happens after the fact, IR happens while the attacker is still in the environment, or shortly after they leave. Most teams structure their process around a lifecycle adapted from the SANS PICERL model: preparation, identification, containment, eradication, recovery, and lessons learned. The stages blur together during a real incident, but each one has a different goal and a different set of tools.
Preparation
Preparation covers everything done before an incident happens: building playbooks, deploying EDR and logging infrastructure, defining escalation paths, and running tabletop exercises so the team knows what to do when something breaks. An IR plan that only exists on paper falls apart under pressure, so this stage also includes testing backups, confirming log retention is long enough to trace back incidents, and making sure the right people have the right access before they need it at 2 a.m., spamming you on Slack.
Identification
This is where an alert turns into a confirmed incident. Analysts triage EDR detections, SIEM correlations, or user reports to figure out what actually happened: which host, which account, what process, and how far it has spread. Scoping mistakes made here carry through the rest of the response, so this stage often loops back on itself as new hosts or accounts turn up. Common data sources at this point include EDR telemetry, firewall and proxy logs, authentication logs, and any memory or disk artifacts pulled for a quick look.
Containment
Containment stops the incident from getting worse while the investigation continues. It splits into two approaches:
Short-term containment isolates affected hosts from the network (often through EDR network isolation), disables compromised accounts, or blocks known-bad IPs and domains at the firewall. The goal is to buy time without destroying evidence.
Long-term containment puts more durable controls in place while eradication is planned: rebuilding trust boundaries, rotating credentials that may have been exposed, segmenting affected systems, or applying emergency patches to the vulnerability that was exploited.
A common mistake at this stage is killing a malicious process or wiping a host before memory and disk artifacts are captured. Once a machine is powered off or reimaged, volatile evidence is gone for good, so containment should be sequenced with evidence collection rather than done first and asked about later.
Eradication
Eradication removes the attacker’s foothold: malware, backdoors, scheduled tasks, rogue accounts, and any persistence mechanism found during the investigation. This step depends heavily on the disk artifacts covered above. Run keys, scheduled tasks, and services are the usual places persistence hides, so eradication often means walking back through the same registry hives and event logs used during identification, this time to confirm nothing was missed. Root cause matters here too. Removing the malware without patching the initial access vector just invites a repeat visit.
Recovery
Recovery restores affected systems to normal operation: rebuilding hosts from known-good images, restoring data from backups, and reintroducing systems to the network under closer monitoring. Systems coming back online are usually watched more closely for a period afterward, since a partially eradicated threat tends to resurface within days rather than months.
Lessons Learned
A post-incident review documents the timeline, root cause, what worked, and what didn’t. This is also where detection gaps get turned into new SIEM rules or EDR policies, and where the IR plan itself gets updated if it didn’t hold up. Skipping this stage is common under time pressure, but it’s usually the difference between an organization that improves after each incident and one that keeps having the same incident with a different hostname.
Live Monitoring and EDR
Endpoint Detection and Response (EDR) tools sit on the host and give responders visibility that static forensic artifacts can’t, i.e process creation in real time, network connections when they open, and the ability to isolate a machine or kill a process remotely without touching the machine physically. Enterprise options include CrowdStrike Falcon, Microsoft Defender for Endpoint, SentinelOne, and Elastic Security. On the open-source and free-tooling side, Sysmon combined with a SIEM, i.e Security Information and Event Management (Splunk, Elastic, or Wazuh), covers a lot of the same ground for smaller environments or home labs.
SOAR (Security Orchestration, Automation, and Response) platforms like Cortex XSOAR or Splunk SOAR are used for automating repetitive response actions such as isolating a host, disabling an account, or opening a ticket when an alert fires.
| Function | Tool | Notes |
|---|---|---|
| EDR | CrowdStrike Falcon / Defender for Endpoint / SentinelOne | Real-time telemetry, remote isolation, rollback in some products |
| SIEM | Splunk / Elastic Security / Wazuh | Log aggregation, correlation rules, alerting |
| Host-based logging | Sysmon | Free, feeds process, network and file event data into a SIEM |
| Network monitoring | Zeek / Suricata | Traffic analysis, IDS/IPS signatures |
| SOAR | Cortex XSOAR / Splunk SOAR | Automates containment playbooks |
| Threat intel enrichment | VirusTotal / MISP | Hash, IP and domain reputation lookups |
| Ticketing / case management | TheHive / Jira | Tracks investigation timeline and evidence handling |
None of these tools replace the process. An EDR alert still needs an analyst to scope it, a playbook still needs someone to follow it under pressure, and the forensic artifacts covered earlier on this page are usually what confirms or corrects whatever the tooling reported first.
Closing Note
DFIR functions most effectively when the two parts support one another. The forensics side provides the evidence which explains what took place, and incident response then uses that evidence to determine the next steps. The bifurcation should not stop you from building a solid base in both, even if you plan to specialize in one later down the road.
If you’re beginning your journey, select one item from each section and apply it practically. Analyze a pcap file from Netresec, and run Volatility on a memory dump from the Awesome Memory Forensics list. You should also try using Velociraptor on your spare computer as an endpoint monitoring solution. A lot of free (and paid) practice labs can be found on TryHackMe and Hack The Box. Although the tools may change over time, the habits remain unchanged: always preserve the evidence first, check everything before coming to a conclusion, and make sure you record all your actions.
Thank you for reading, and I wish you all the best in your journey <3.
Leave a Reply